.avif)
City Gasoline Consumption Digital Billboard
The billboard encourages individuals and the community to take actions like switching to electric vehicles, driving less, or participating in planning efforts to reduce emissions.
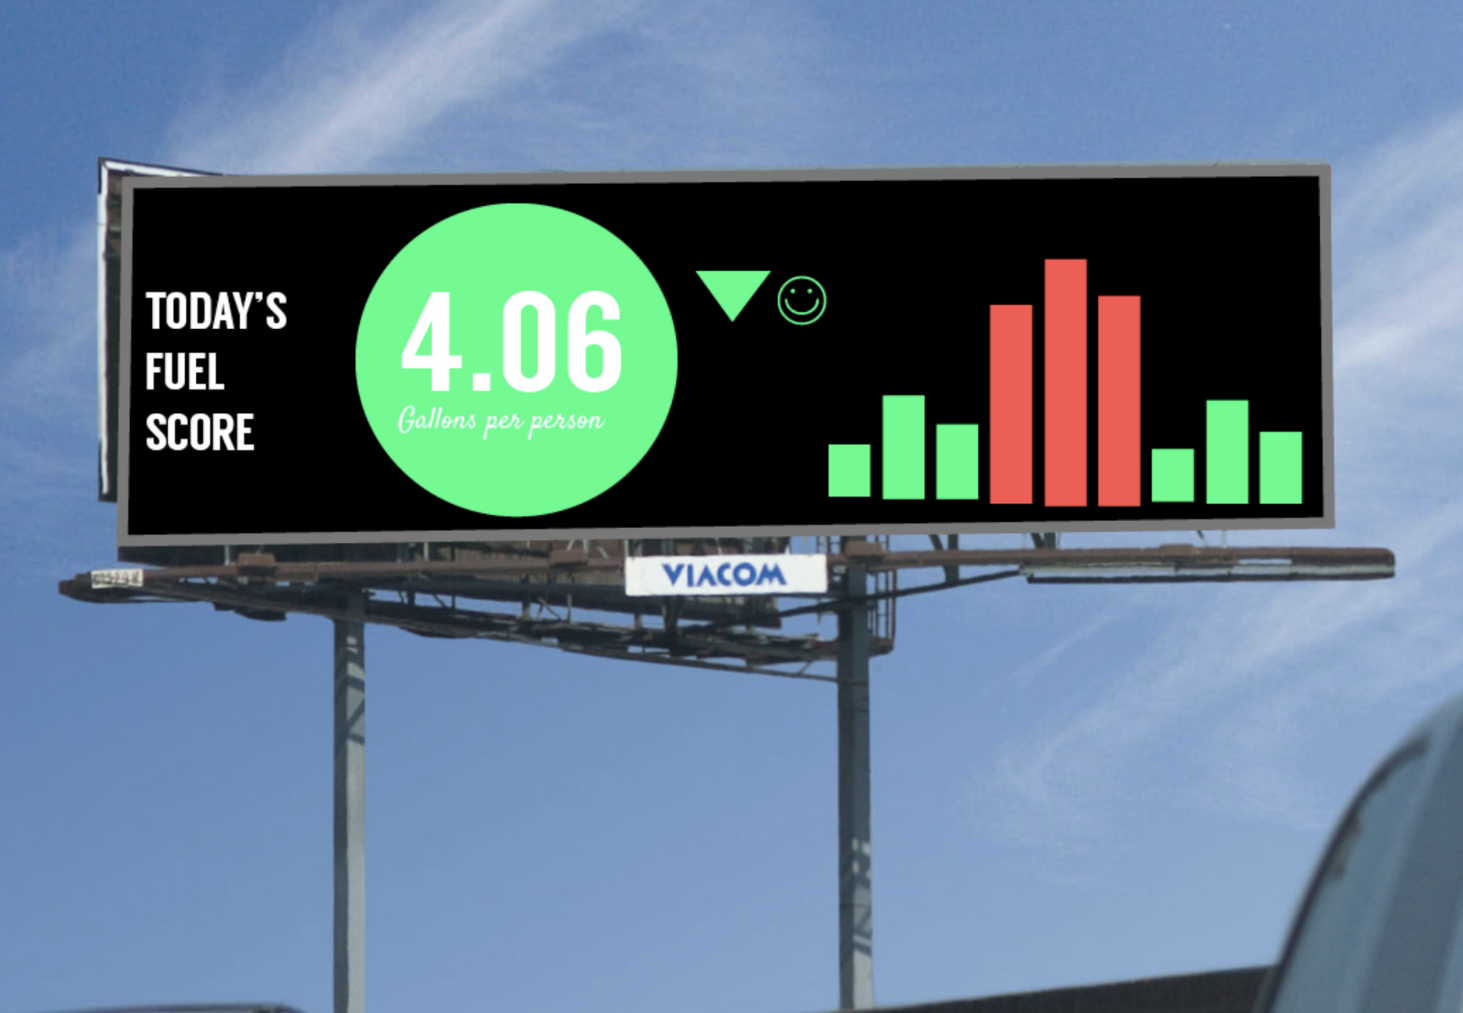
This project features a real-time digital billboard that displays a city’s cumulative gasoline consumption and carbon emissions in a gamified style. The billboard updates daily, showing the total amount of fuel purchased and the equivalent carbon emissions through color-coded bar charts, with green indicating low consumption and red indicating high. A smiley or frowny face is displayed based on the corresponding emissions to provide an emotional cue.
Key Features:
- Daily Gasoline Consumption Score:
- Displays the city’s total gasoline consumption each day, represented in bar charts, with clear visual cues for high (red) and low (green) consumption.
- Real-Time Feedback Loop:
- Provides real-time data on fuel consumption and emissions, allowing the community to see their impact and adjust behavior accordingly.
- Gamified Visual Design:
- Uses smiley or frowny faces alongside the bar charts to reflect the city’s carbon performance, making the data more relatable and engaging.
- Call to Action for Sustainability:
- Encourages the community to reduce fuel consumption by switching to electric vehicles, driving less, going car-free, or participating in city-wide planning efforts to lower emissions.
The digital billboard serves as a public tool to disclose the city’s gasoline consumption, motivating individual and collective actions to reduce emissions through real-time visual feedback.
Psychology Techniques

Ambient Messaging

Community Scale Feedback

Feedback Loop

Tracking Progress
