
In Week 5, students investigate the fuel efficiency of local vehicles and evaluate emissions in a fun data science mission. Then they map out their local bike advocacy community and design a car-free school drop-off zone.
Join Earth DoctorsIn Week 5, students investigate the fuel efficiency of local vehicles and evaluate emissions in a fun data science mission. Then they map out their local bike advocacy community and design a car-free school drop-off zone.
Join Earth Doctors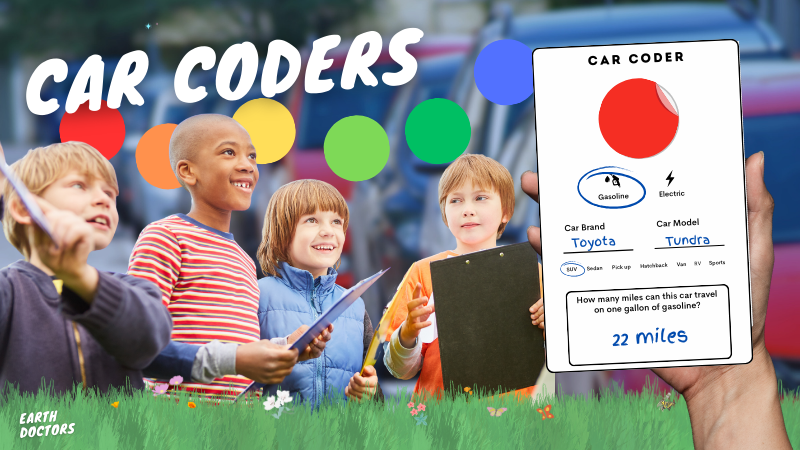
Document the MPG of cars in your community, assign each one a color, and combine the results into a bell curve.
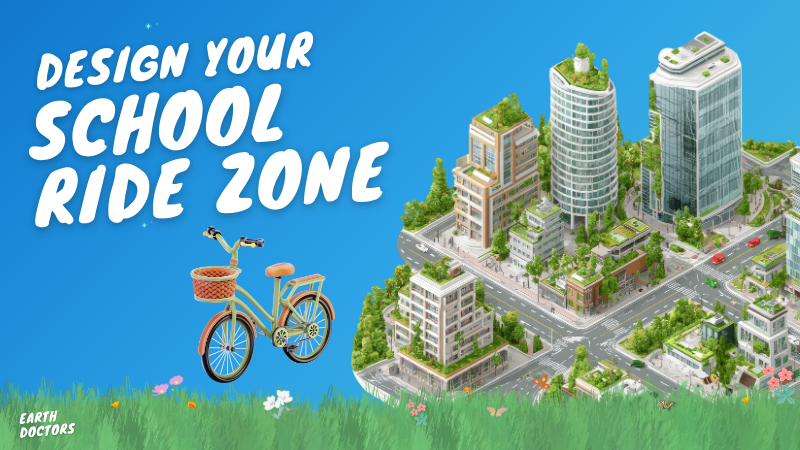
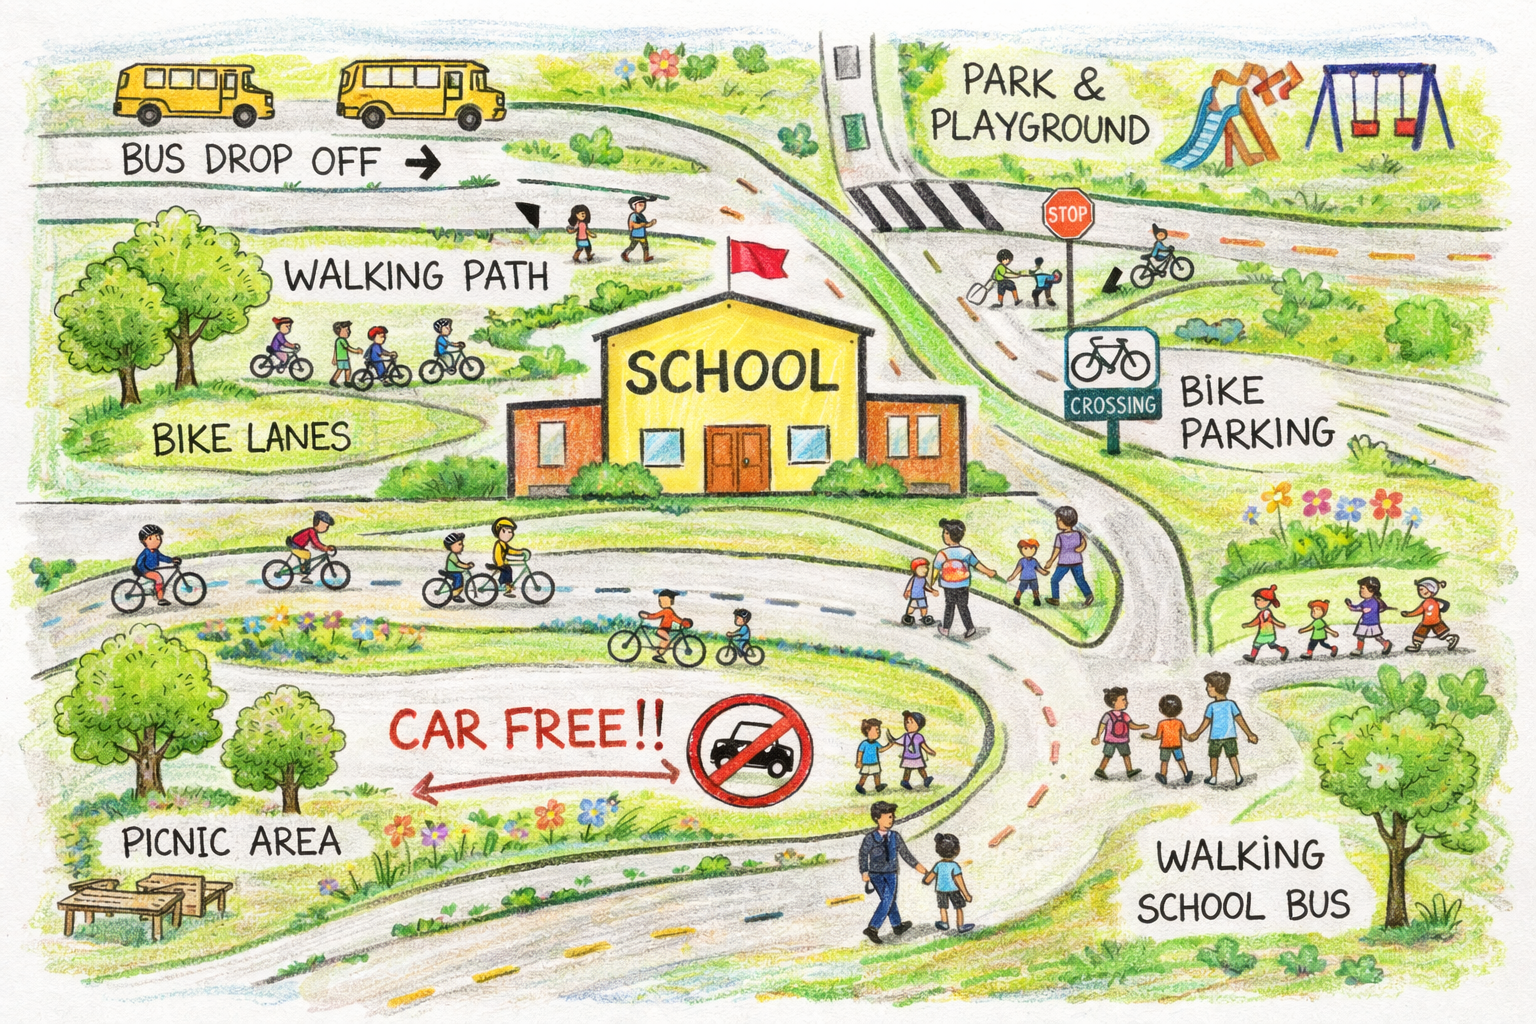
What would your school drop-off area look like if it were car-free? Kids design a new system.
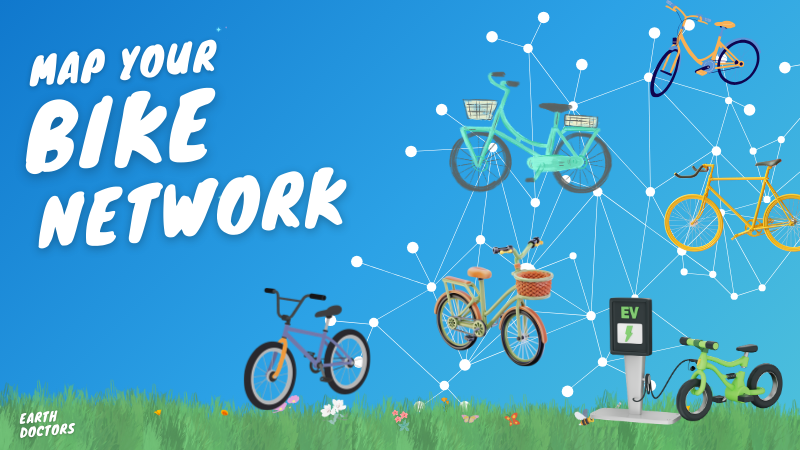
Get to know your local bike community and how road and transport decisions are made in local planning systems.
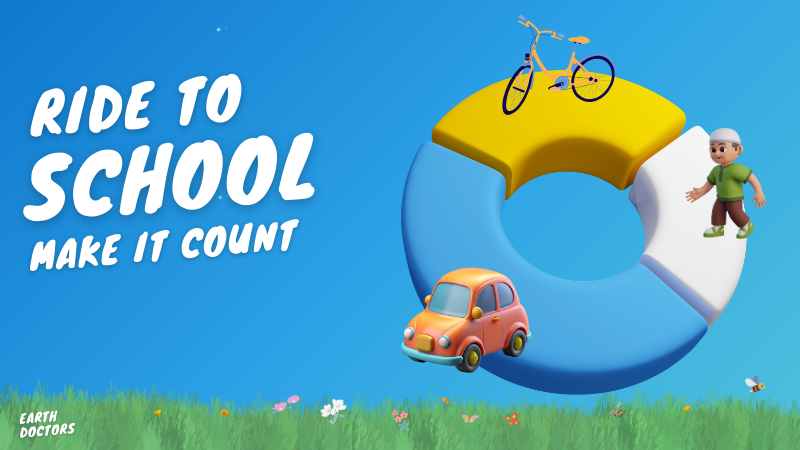
Host a Ride to School Week and track the data. What were the rates before, during, and after?
-1.avif)
-2.avif)
.avif)
.avif)
.avif)
.avif)
Join Earth Doctors to get access to this activity +50 more, our global community, and complete kit of everythink you need to host your own club.
Join Earth Doctors • Get This Activity.avif)